HRV Tracker icon

HRV Tracker

Your heart rate variability, sleep, energy, strain and stress — each read against your own usual, with a Stats tab that tests what moves them and says plainly when it cannot tell.

Free — No ads — No subscription

Download on the App Store See what it does
Made for iPhone Duo

Unfold it: two columns

Closed, HRV Tracker is the iPhone app you know. Open the iPhone Duo — or turn an iPad on its side — and every page lays out in two columns: what was measured on the left, how it reads on the right. Fold it again with a page open and the page follows.
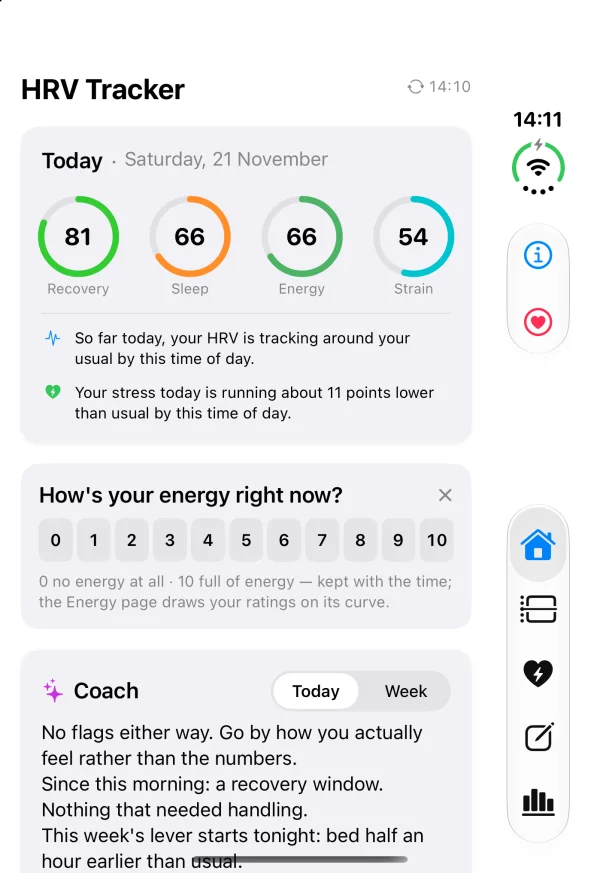
HRV Tracker on the outer screen of a closed iPhone Duo: the four scores, the energy rating and the coach
Closed — one column
HRV Tracker on an open iPhone Duo: the scores, energy rating, timeline and tiles on the left; the coach and the day's vitals on the right
Open — the day as measured on the left, as read on the right
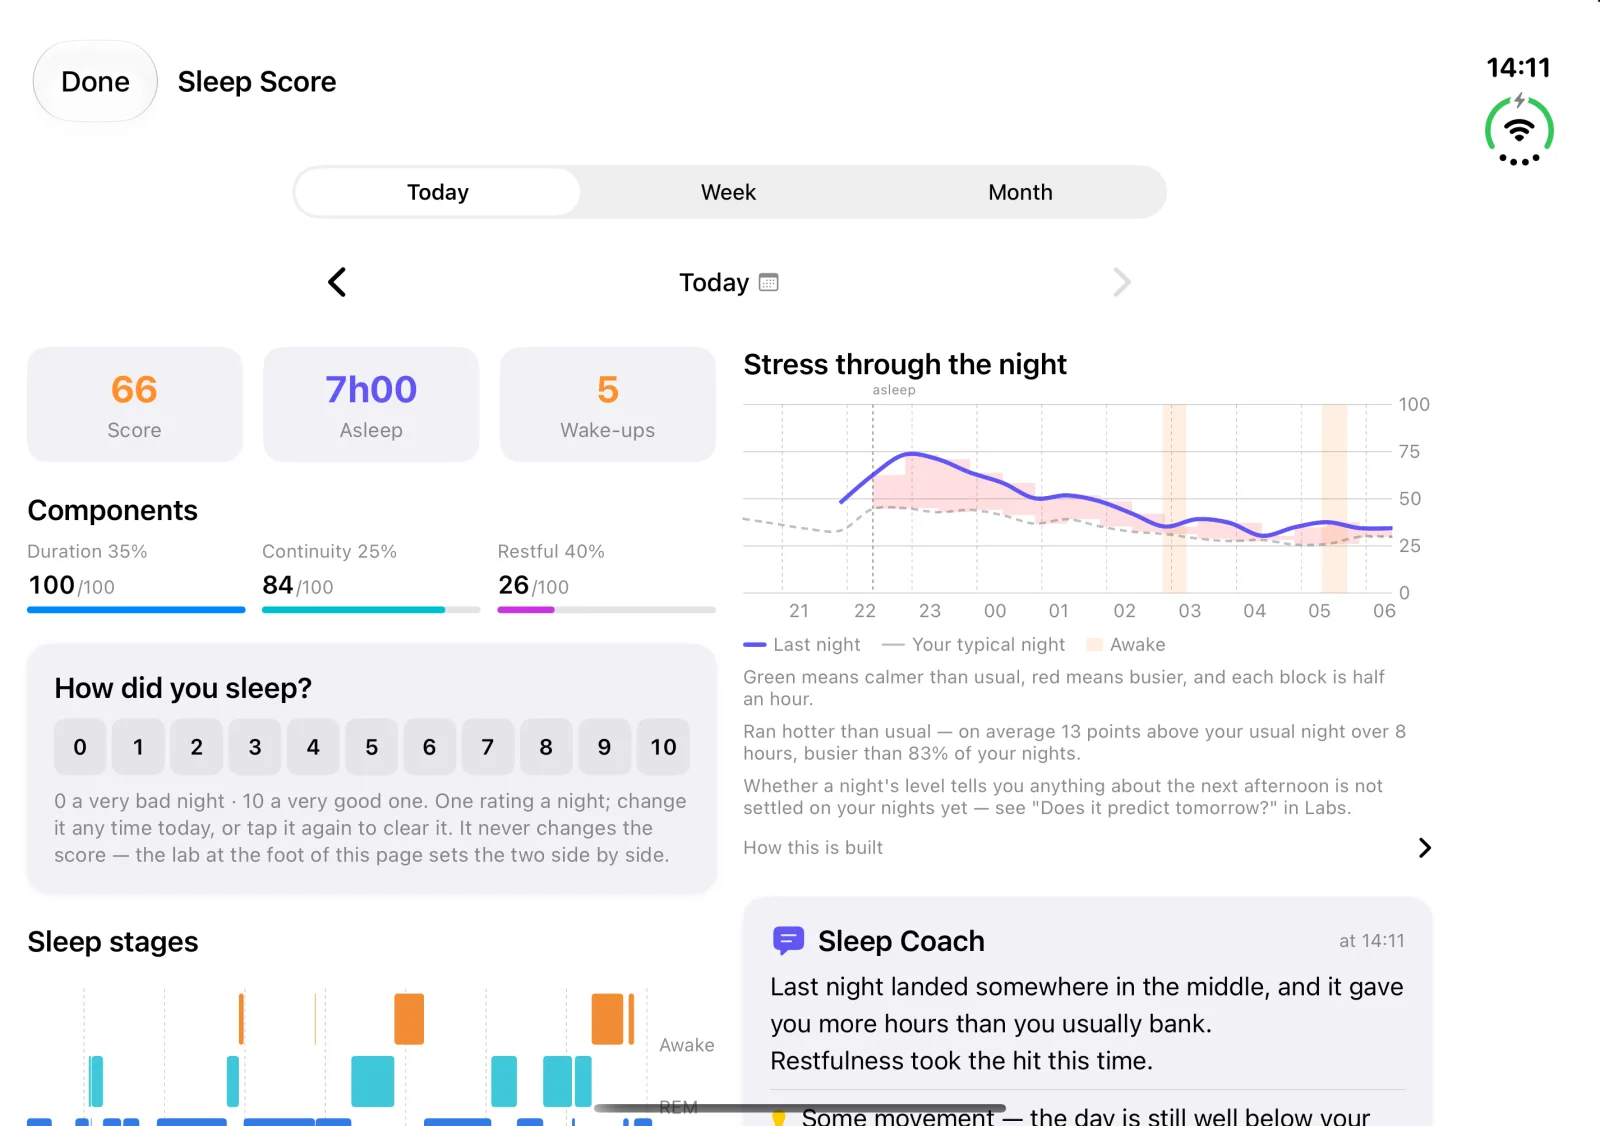
The Sleep page on an open iPhone Duo: the night's figures, components and stages on the left; stress through the night and the sleep coach on the right
Every page opened from a score fills the screen — here, last night

What it does

Every number is compared with you — your recent weeks, your usual at this hour, your usual for this weekday — never with a population average. The screenshots show one real user's data.
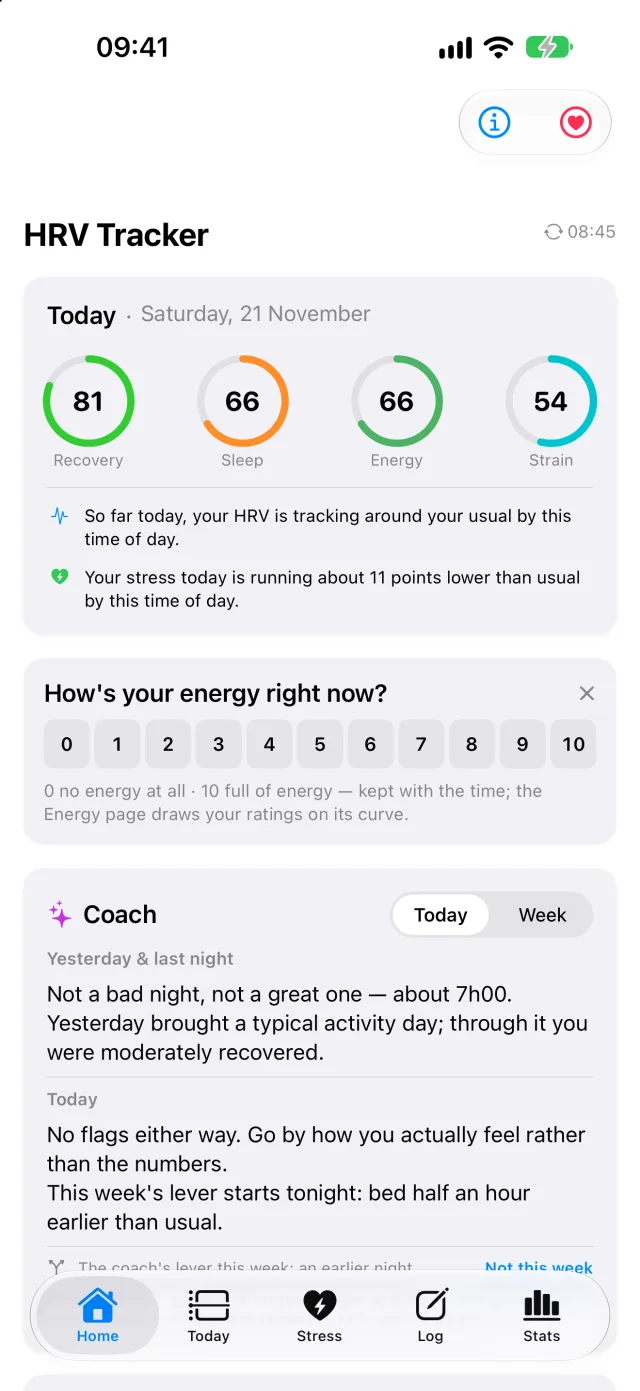
Home screen: Recovery 81, Sleep 66, Energy 66, Strain 54, the energy rating and the coach's morning note
Home

Four scores for the day, and a note that explains them

  • Recovery — your latest HRV against your own last 30 days, at the same hour.
  • Sleep — duration, continuity and how restful the night was.
  • Energy — a reserve that recharges while you sleep and drains through the day.
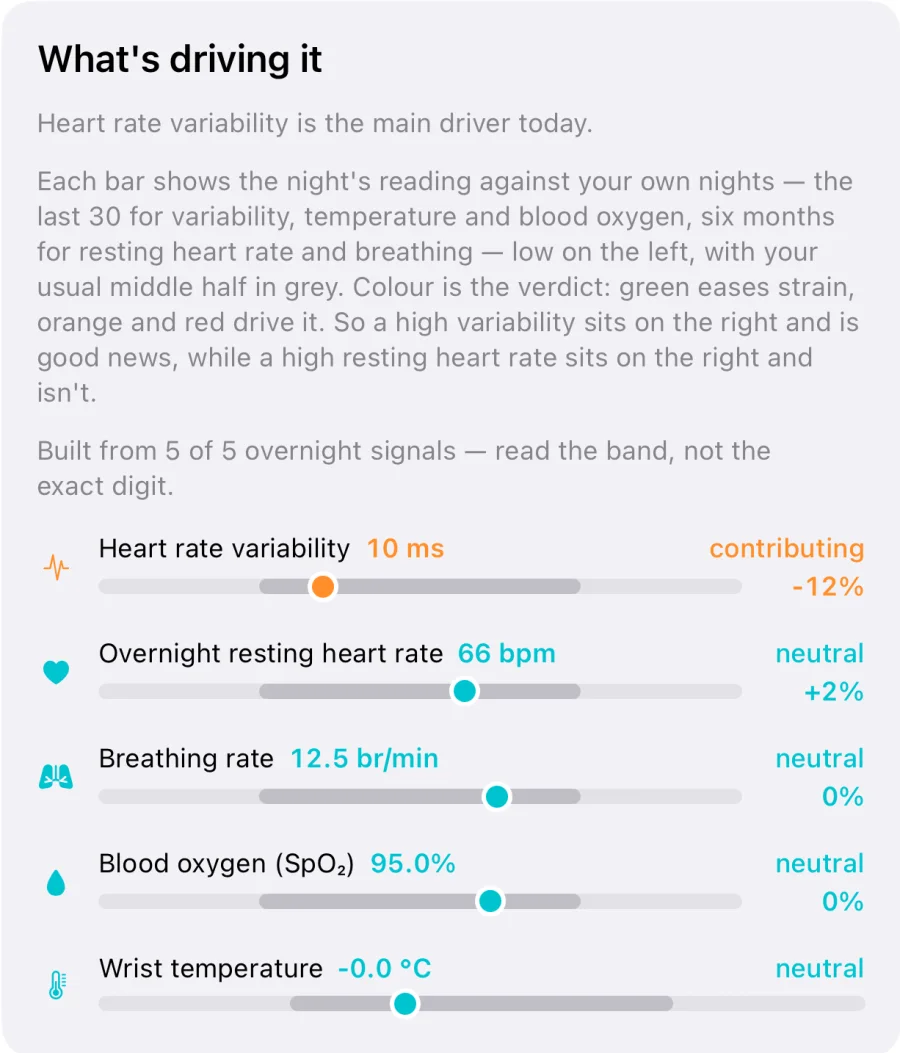
  • Strain — five overnight signals (HRV, resting heart rate, wrist temperature, breathing, blood oxygen), each ranked against your own nights.

Below them: how today is going against your usual by this hour, a one-tap rating of the energy you feel, and a coach note written on your iPhone by Apple's on-device model.

Today tab: a timeline of the day's events and today's signals
Today

The day as it happens

A timeline of what your own data shows — a recovery window, a calm stretch, a spell of elevated stress, when you woke — and the day's signals in plain sentences, each compared with the same hours on your usual days.
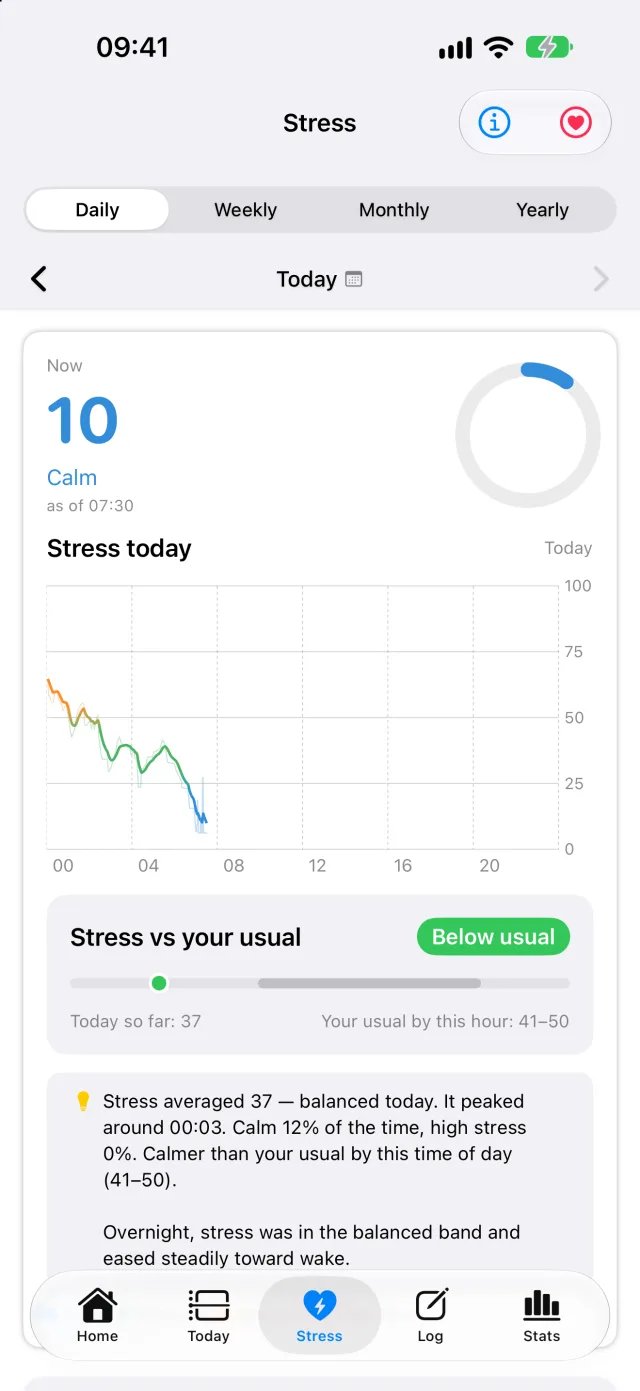
Stress tab: the day's stress curve and how it compares with the usual by this hour
Stress

A stress curve that knows when you are moving

A 0–100 curve across the day and night: your heart rate above your resting level, and your HRV against your own record. Workouts are left out of the curve. Day, week, month and year views, each set against your usual.

Energy page: the reserve curve with the energy ratings drawn on it
Energy

A reserve, hour by hour

The night's sleep fills it; awake, it declines slowly, with a small credit for rest. The ratings you give — "How's your energy right now?" — are drawn on the same chart, so you can see where the curve and your feeling agree and where they don't. Your rating never moves the curve.

Sleep page: score 66, 7h00 asleep, its three components and the night's stages
Sleep

A score you can take apart

Three components with their weights on screen — duration, continuity, restfulness — the night's stages and wake-ups, and an optional 0–10 rating of how you slept. Your rating never changes the score: a lab sets the two side by side instead.
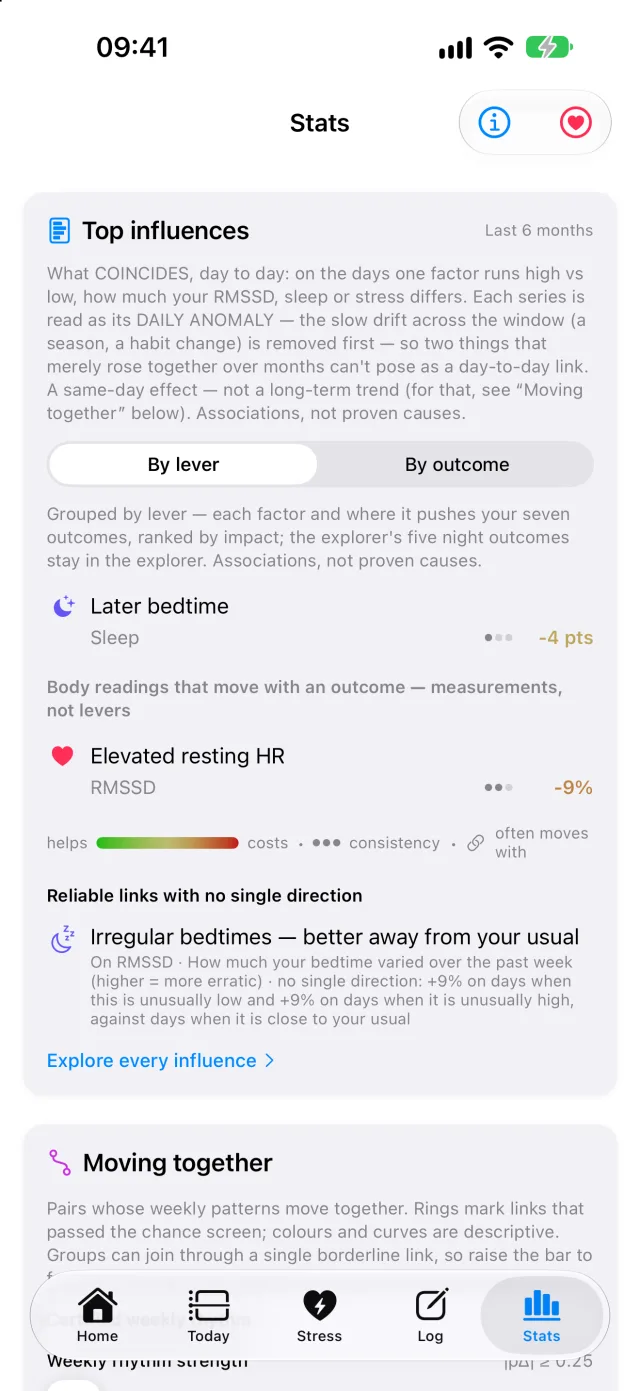
Stats tab: top influences grouped by lever, each with its effect and consistency
Stats

What actually moves your numbers

Bedtime, steps, daylight, workouts, caffeine, outdoor temperature, what you log yourself… each factor is set against your RMSSD, sleep, stress and night heart rate. Before a link is shown it has to beat chance across every comparison asked, so a long list of tries cannot produce a lucky winner.

  • Top influences — what coincides day to day.
  • Moving together — what rises and falls in step, week to week.
  • Long-term trends — how each measure moved over six months, and your habits beside it.
  • A link close to the bar is shown greyed, "seen, not retained", instead of coming and going.

A closer look

Parts of the pages behind the scores — each with what it compares you with, written on the card

Stress through the night: last night's curve against your typical night, half-hour blocks coloured by how far they ran from it
Stress through the night. Last night against your typical night, half an hour at a time — here, a night that ran hotter than 83% of the others.
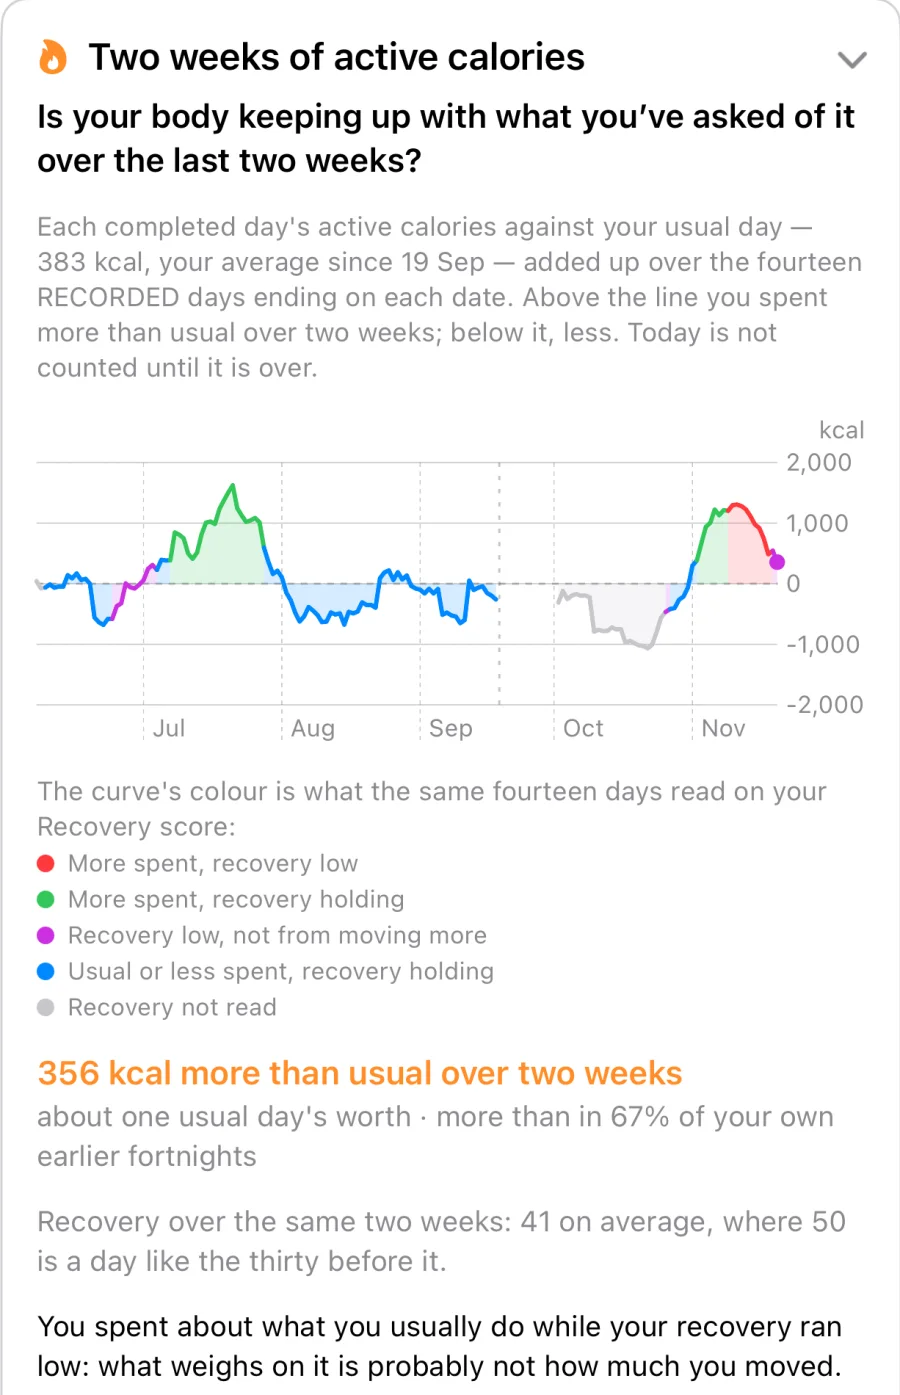
Two weeks of active calories: the running two-week balance, coloured by what the Recovery score read over the same days
Two weeks of active calories. What you spent above or below your usual over fourteen days, coloured by what your recovery did over the same days.
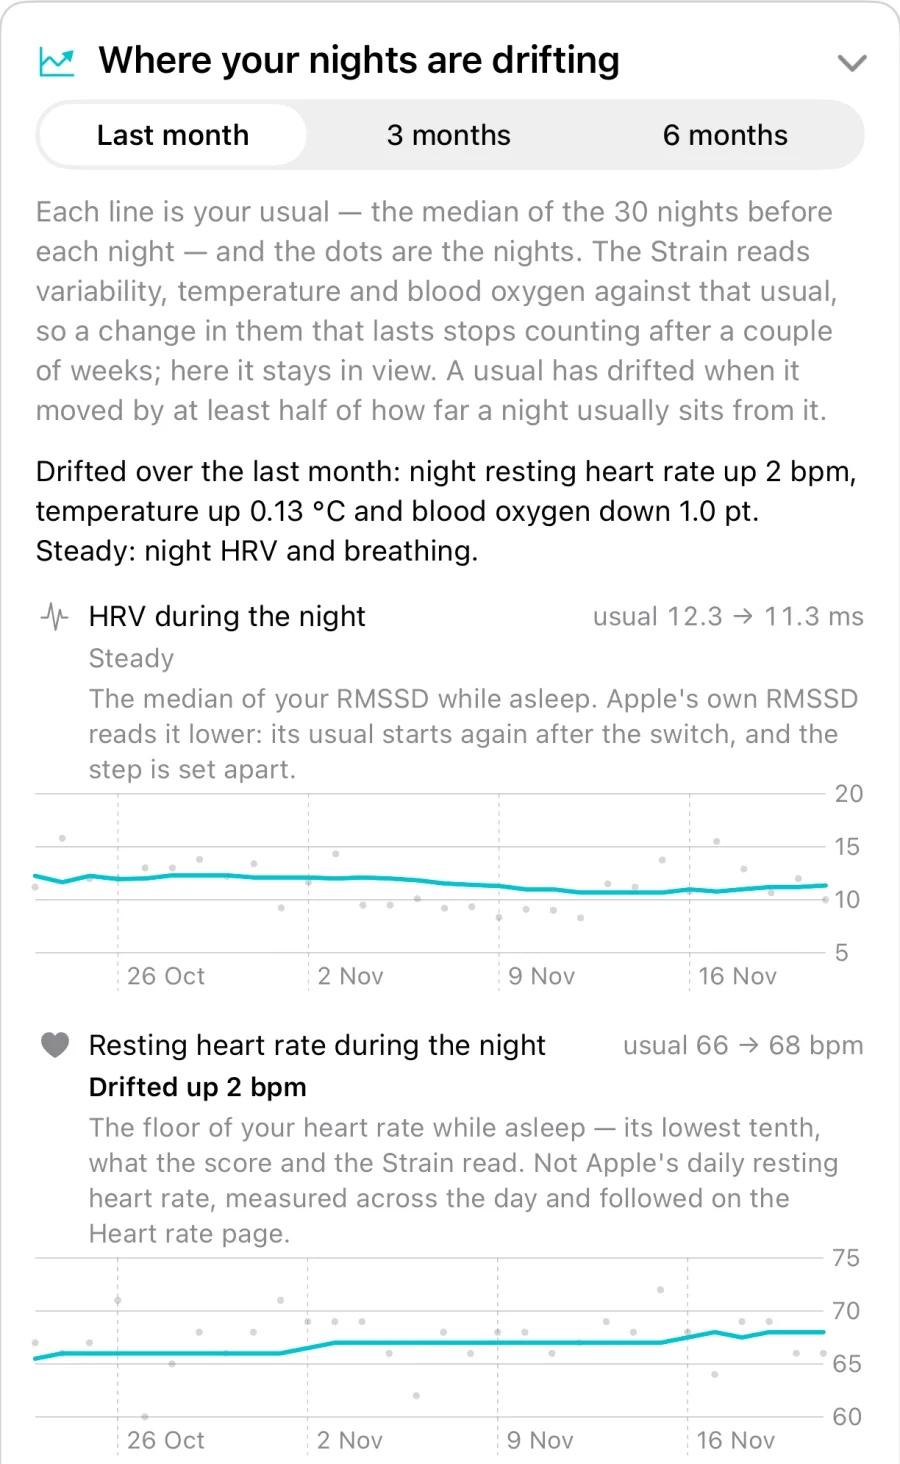
Where your nights are drifting: each night signal's usual over the last month, with the nights as dots
Where your nights are drifting. Each usual as a line, each night as a dot, and which ones moved over one, three or six months.
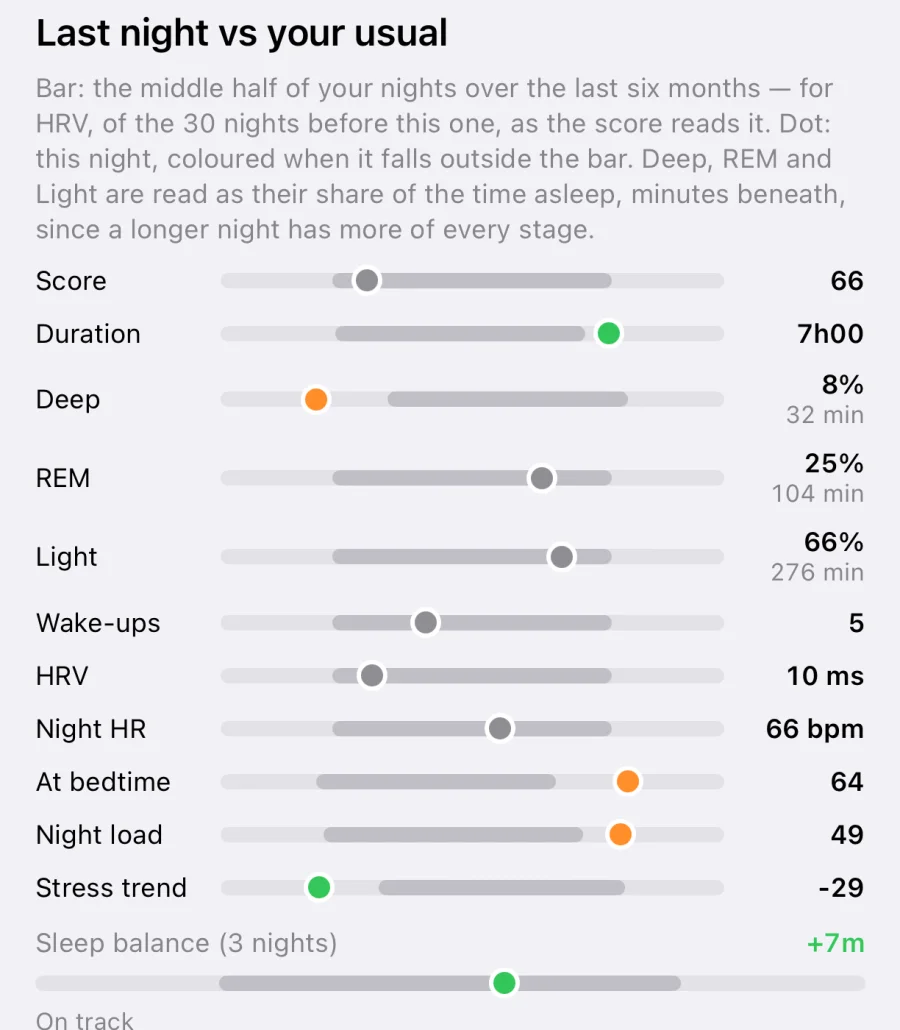
Last night vs your usual: each part of the night on the middle half of your own nights
Last night vs your usual. Every part of the night on the middle half of your own nights — coloured only when it falls outside.
What's driving strain: five overnight signals, each against your own nights
What's driving your strain. Five overnight signals, each against your own nights, and which one leads.
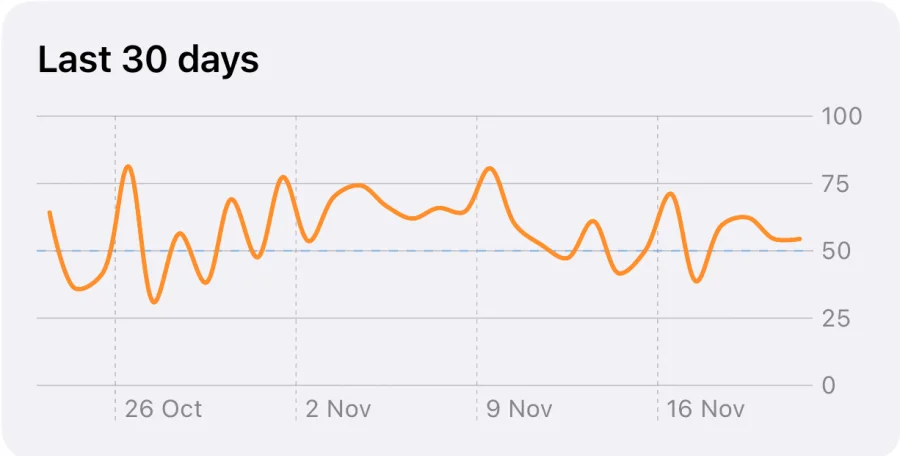
Strain over the last 30 days
Strain over 30 days. 50 is your typical night.
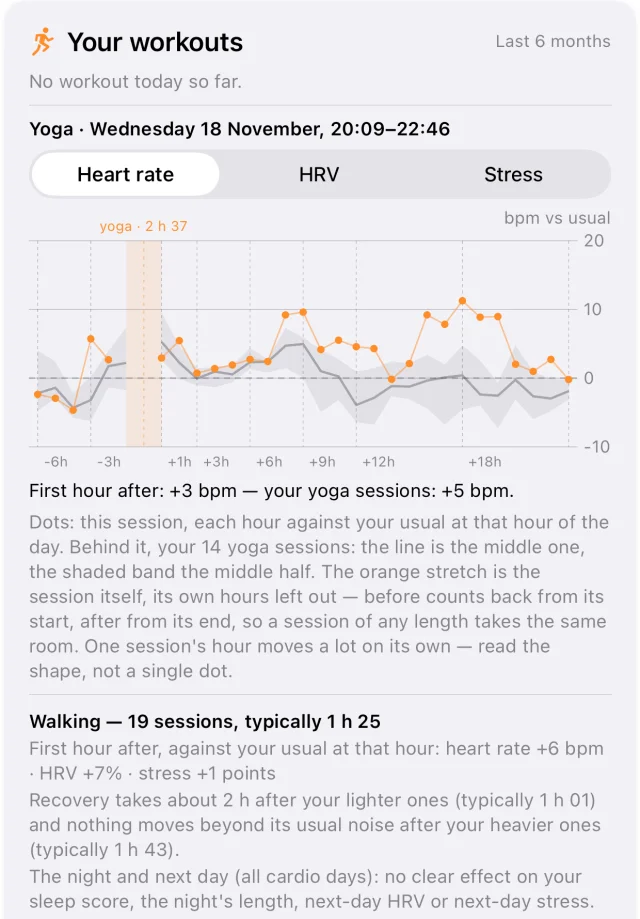
Your workouts: one yoga session's heart rate hour by hour against your usual, over the band of your fourteen yoga sessions, then what each kind of session does to the hour after and the night after
Your workouts. A session hour by hour against your usual, over the band of your other sessions of that kind — then, for each kind, the first hour after, how long recovery takes and what the night after does.
A day of Recovery readings, each against your last 30 days at the same hour, and the day placed on your usual range
A day of recovery. Every reading against your last thirty days at the same hour, and the whole day placed on your usual range.
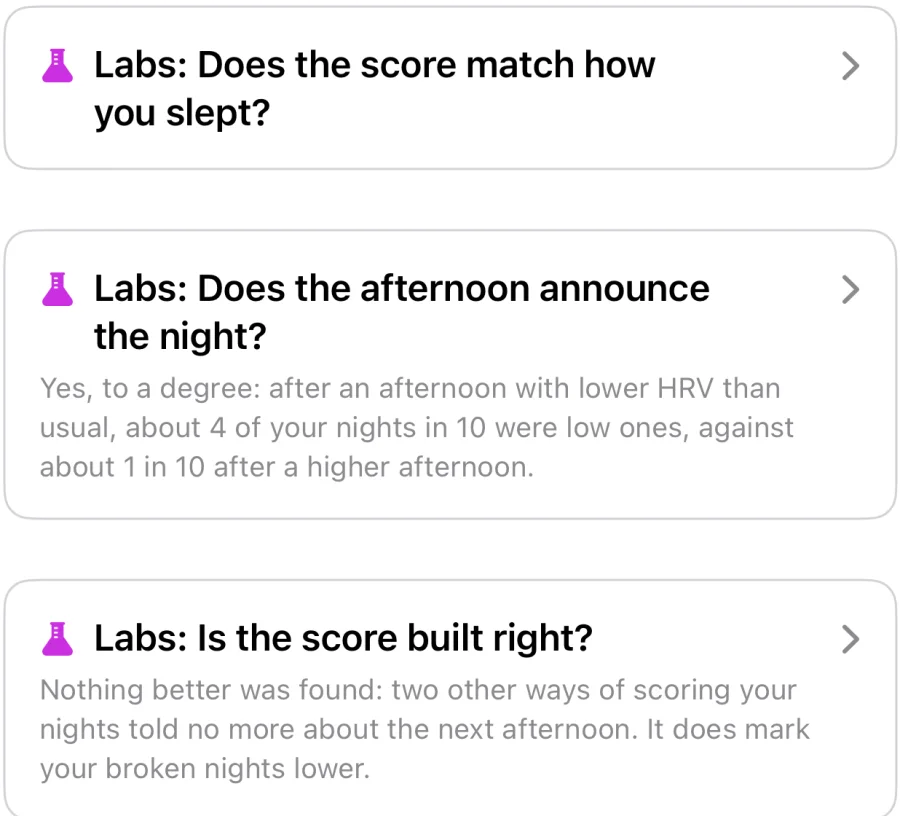
Three sleep labs, each opening on its answer
Labs on the Sleep page. Each opens on its answer — "yes, to a degree", "nothing better was found".

On your wrist

A watch app and complications that read the same record as the iPhone, refreshed in the background

Watch face with HRV complications: a recovery ring, the day's RMSSD curve and the latest reading
Complications: recovery, the day's HRV curve, the latest reading and its trend
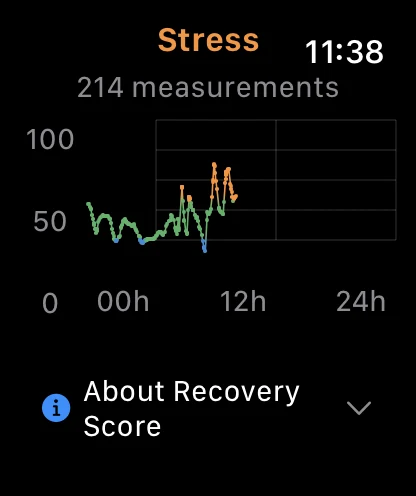
Watch app: the day's stress curve
The day's stress curve
Watch app: latest HRV with its recovery gauge
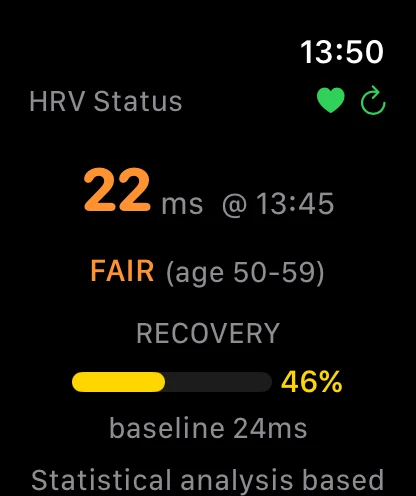
Latest HRV and its recovery against your baseline

Your own log

What Apple Health cannot see, you can note in a tap — and the app reads it against your nights like everything else

✍️

Habits, yes or no

Late caffeine, alcohol, a late meal, a screen before bed, a nap, travel, feeling unwell — or a habit of your own. A blank day stays a blank: only the days you answer count.

🔢

Or how much

Glasses of water, drinks, cups: an amount is read one by one — heavier days against lighter ones, the change per extra one, and for water, over three days.

🌙

Read against the night that follows

Once a habit has five days on each side, its nights — HRV, sleep score, night heart rate — are compared with your usual and screened with every other logged question. Until then, the app shows how many days it still needs.

⚡

How you feel, too

Rate your energy whenever you like and your night once a day, 0 to 10. Your ratings are drawn beside the curves and compared in two labs; they never change a score.

📈

Week after week

After eight weeks of answers, a habit joins the long-term view: whether it moves week to week with your measures, tested like the rest.

🧳

Context for the coach and the labs

Travel and feeling unwell are read by the coach and named beside any stretch that stood out — so a week away is not taken for a change in you.

Labs

A lab asks one question of your own record, answers it in a sentence, then shows its working. Nothing in a lab changes a score.
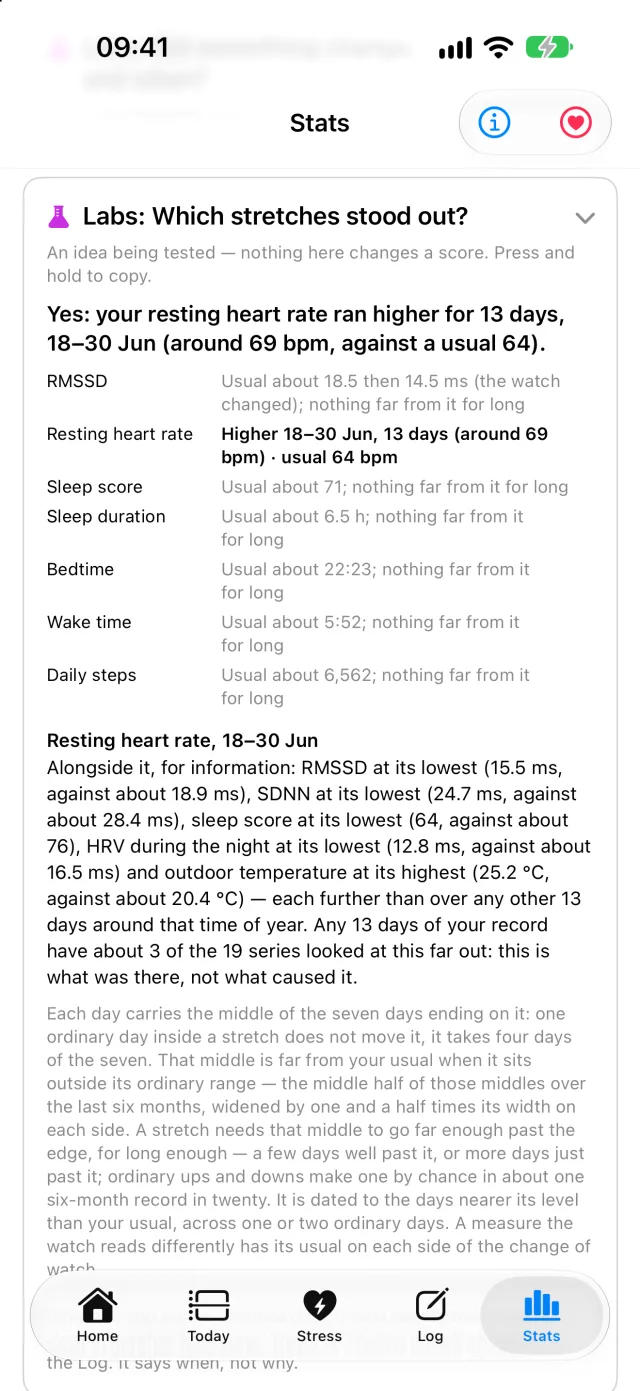
Lab: which stretches stood out — resting heart rate ran higher for 13 days in June
Example

"Which stretches stood out?"

Over six months, this user's resting heart rate ran higher for 13 days in June — around 69 bpm against a usual 64. The lab dates the stretch to the day and lists what else was unusual over those same days: lower HRV, a lower sleep score, the warmest days of that season.

It also says how many series any 13 days would show that far out by chance: what was there, not what caused it.

Where is it drifting?Five cards — your HRV, resting heart rate, sleep, nights and days — each saying how far its usual moved over one, three and six months.
Did something change, and when?A level that moved and stayed, dated to its week.
Which stretches stood out?Spells far from your usual, and what came with them.
Does the curve match how you feel?The energy reserve against your own ratings.
Does the score match how you slept?The sleep score against your own ratings.
Does the afternoon announce the night?Afternoon HRV against the night that follows.
Does a low stretch last?Whether low days run in series longer than chance.
Is the stress curve just your heart rate?What the stress score adds to heart rate alone.
Is the reserve the night's score again?Whether the energy curve says more than the sleep score.
Is it you, or the reference?A change in you, or in the window you are compared with.
Is the score built right?The sleep score and its parts against the next day's HRV.
Day readHow a day differs from the same weekday.
Fitness ageYour VO₂max against published norms by age, with its trend.
How you walkWalking measures over the months.
Test it on yourselfA randomised 28-day experiment on one habit, read at the end.

How each one is computed is on the methodology page.

And also

The pieces around the scores

✨

On-device coach

A morning note and a weekly view written by Apple's on-device language model from figures the app has already computed. It runs on your iPhone. Needs a device with Apple Intelligence.

📱

Widgets

Stress and HRV on your Home Screen and Lock Screen.

🔁

A new watch, handled

A new watch, or Apple's own RMSSD, can read lower or higher than before. Measures it moves are compared on each side of the change, so a new device does not pass for a change in you.

🧪

Honest about chance

Associations, not causes. Every link says how many days it rests on, links that could be chance are set apart, and the app says "too few days yet" rather than guess.

Recovery zones

Your Recovery score, from 0 to 100, reads your latest HRV against your own last 30 days at the same hour: 50 is your usual

5

Peak recovery

Score 85 and above — well above your usual: ready for intense effort

4

Good recovery

Score 60 to 84 — above your usual

3

Baseline

Score 40 to 59 — around your usual

2

Light fatigue

Score 20 to 39 — below your usual: keep it easy

1

Deep fatigue

Score under 20 — well below your usual: rest recommended

Your data stays yours

The analysis runs on your iPhone. There are no accounts, no analytics and no advertising.

🔒

Read from Apple Health, on the device

The app reads what you allow in Apple Health and computes everything on your iPhone and Apple Watch. It has no server of its own, and your health data is not sent anywhere.

✨

The coach runs on your iPhone

The coach's notes are written by Apple's on-device model from figures the app has already computed. No text leaves the phone.

🌤️

Weather, if you allow it

To read outdoor temperature as a factor, the app asks Apple's WeatherKit for your local weather, using an approximate location (to the kilometre) while the app is open.

☁️

iCloud sync, off by default

If you turn it on, your journal and the coach's memory sync between your devices through your own iCloud account. Health data is never synced by the app.